
The Kill Criteria: How Tesla Decides Which Battery Innovations to Pursue (And Which to Abandon)
At Tesla’s 2020 Battery Day, Elon Musk promised a 56% cost reduction and 69% CAPEX (capital expenditure) reduction through revolutionary dry electrode technology (Manthey, 2020). Three years later, Tesla quietly pivoted to a hybrid approach, delaying their volume ramp.
Why did Tesla abandon a technically superior solution?
Because innovation without business viability is just expensive science.
This article uses Tesla’s battery decisions as a case study to demonstrate decision-making frameworks you can apply in your organization. Specifically, how Paired Comparison and Expected Value (the lightweight decision tools from our Choose-It framework) can help engineering leaders distinguish between innovation theater and business-critical R&D.
Important: The dollar values and probability estimates in this analysis are illustrative examples designed to demonstrate the decision-making framework. They are based on publicly available industry data and Tesla’s stated goals, not internal Tesla financials.
We don’t have access to Tesla’s internal data, just publicly available information. We’re reconstructing how systematic decision tools would have framed these choices. The goal is to show you the *process*, not to claim we know exactly how Tesla decided.
The Tesla Case: Three Battery Pivots, Three Kill Decisions
Between 2018 and 2024, Tesla made three major battery technology pivots. Each time, they walked away from what appeared to be the technically superior choice. Let’s examine how systematic decision-making tools would have revealed why these “kills” were actually the right calls.
The Five Constraint Categories: Tesla’s Decision Framework
Before diving into the pivots, let’s establish the constraint categories that seemed to govern Tesla’s battery decisions:
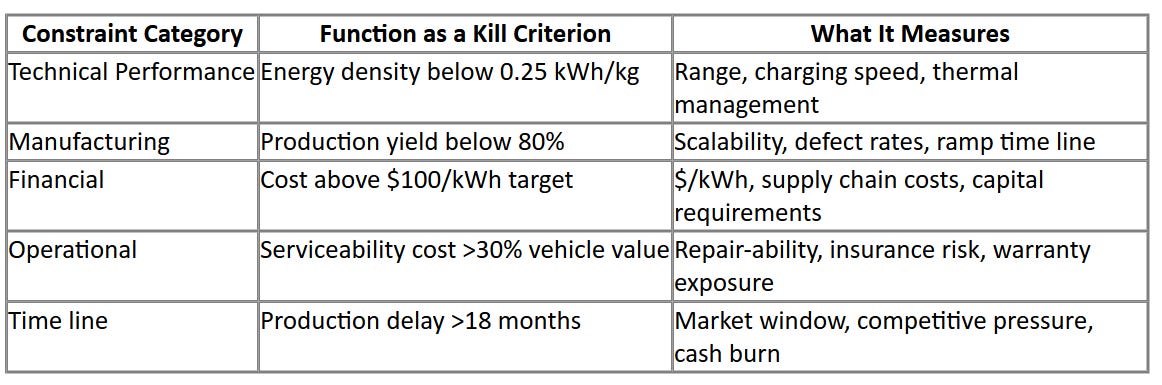
These aren’t abstract goals. They’re quantified thresholds that trigger project termination. This is where EV becomes the “definitive filter”: it forces you to quantify what “too risky” actually means.
🔋Pivot One: NMC vs. LFP Chemistry (2020-2021)
A. The Technical Comparison (Paired Comparison)
Tesla faced a choice between two chemistries for their standard-range vehicles:
Criteria
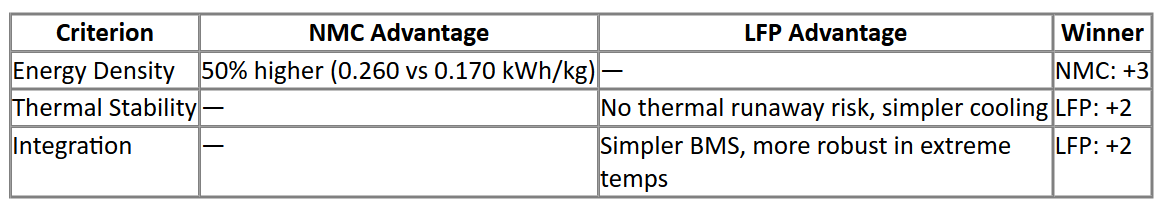
- Energy Density (range per kg)
- Thermal Stability (safety, cooling complexity)
- Integration Complexity (battery management system (BMS) requirements, pack design)
How We Score It
For each criterion, we compare the two options head-to-head: the winner gets points: +1 if a minimal advantage, +2 for a moderate advantage, and +3 for a major advantage. We then sum the points. This forces explicit trade-offs rather than vague “this seems better” judgments. See this month’s AMA post for more about paired comparison.
Paired Comparison Winner: LFP (4 vs. 3)
LFP wins on two criteria (thermal stability + integration simplicity) that together outweigh NMC’s single advantage in energy density. This makes it the technically safer and easier-to-implement choice.
B. The Business Reality (Expected Value)
Now let’s layer in the business constraints Tesla actually faced.
EV Model Assumptions
- Vs (Value of Success): Net margin improvement per 10,000-unit fleet over 2 years
- Cf (Cost of Failure): Sunk R&D + warranty claims + production delays + supply chain penalties
- Probabilities: Based on supplier reliability, production yield data, and thermal incident rates
Note: The specific dollar values ($1.2M, $800K, etc.) are illustrative figures for decision modeling based on industry-standard battery cost structures and Tesla’s publicly stated cost reduction targets. These represent the scale of value and risk in battery chemistry decisions, not Tesla’s internal financials.
NMC Path
- Vs = $1.2M (higher vehicle prices from extended range)
- Cf = $800K (cobalt supply chain volatility, thermal management R&D, warranty risk from battery fires)
- P(success) = 70% (mature technology, but supply chain and safety concerns)
- EV = (0.70 × $1.2M) – (0.30 × $800K) = $840K – $240K = $600K
The cobalt dependency created significant supply chain risk. Global cobalt consumption increased 20% from 2020 to 2021 due to demand for EV batteries, with supply deficits expected as early as 2022 (IEA Global Supply Chains Report, 2022). Key battery metals such as cobalt and nickel were already facing supply chain constraints during this period (IEA, 2022).
LFP Path
- Vs = 10,000 units × $90 additional margin per vehicle = $900K (lower vehicle prices, but volume advantage)Cf = $250K sunk R&D + $150K warranty reserves = $400K (range perception risk, cold-weather performance concerns)
- P(success) = 85% (simpler tech, stable supply chain, proven safety)
- EV = (0.85 × $900K) – (0.15 × $400K) = $765K – $60K = $705K
EV Winner: LFP ($705K vs. $600K)
C. What Tesla Actually Did
Tesla began transitioning to LFP batteries for its Standard Range models in 2021, particularly for vehicles manufactured in or exported from China (Tesla Q4 2021 Earnings Call).
The Kill Criterion that mattered: Financial constraint. NMC’s cobalt dependency created supply chain risk that exceeded their cost stability threshold. When your production is already supply-constrained, adding another bottleneck with geopolitical risk isn’t innovation, it’s self-sabotage.
Key Insight: When Paired Comparison shows a narrow technical advantage (LFP 4-3) and Expected Value reinforces that choice ($705K vs $600K), the decision becomes clear. LFP wins on both counts: it’s technically safer AND financially superior. Tesla chose LFP for standard range vehicles while continuing NMC development for premium applications where the energy density advantage justifies the supply chain risk.
What happens when technical superiority meets business reality?
🔋Pivot Two: Dry Electrode vs. Hybrid Manufacturing (2020-2024)
A. The Technical Comparison (Paired Comparison)
Tesla’s 4680 cell promised revolutionary cost savings through dry electrode coating—eliminating solvent-based manufacturing entirely.
Criteria
- Cost Reduction Potential ($/kWh savings)
- Manufacturing Complexity (process maturity, yield rates)
- Environmental Impact (solvent elimination, energy savings)
How We Score It
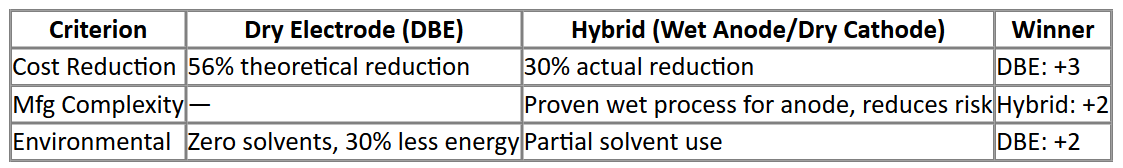
Paired Comparison Winner: Dry Electrode (5 vs. 2)
DBE wins on both cost and sustainability—the two metrics Musk promoted at Battery Day. This should be a slam dunk.
B. The Business Reality (Expected Value)
EV Model Assumptions
- Production volume target: 100 GWh/year by 2025
- Timeline pressure: Cybertruck launch dependent on 4680 ramp
- Yield requirements: 80% minimum for profitability
Note: The specific dollar values below are illustrative calculations based on Tesla’s publicly stated cost reduction targets and typical battery production economics. The probability estimates reflect industry-reported challenges with dry electrode manufacturing at scale.
Early on, Musk argued that battery manufacturing was far too inefficient and that Tesla could reinvent the production process, ditch conventional practices, and cut costs by 50% (The Information, 2024). However, Tesla’s dry-coating process for cathodes wasn’t currently any faster than traditional wet methods, and the company faced high scrap rates during production ramp-up (The Information, 2024). As battery production facilities ramp up, scrap rates can reach upwards of 90% (Battery Materials Review, 2023).
Probability estimates are derived from: (1) publicly reported yield rates and production delays, (2) industry-standard failure rates for similar technologies, and (3) supplier reliability data. For example, the 40% success probability for full dry electrode reflects Tesla’s publicly reported production challenges and the typical 60-70% failure rate for novel manufacturing processes at scale.
Full Dry Electrode Path
- Vs = $2.1M (56% cost reduction at volume)
- Cf = $1.8M (18-month production delay, yield issues, Cybertruck launch miss)
- P(success) = 40% (unproven at scale, adhesion problems in dry cathode)
- EV = (0.40 × $2.1M) – (0.60 × $1.8M) = $840K – $1.08M = -$240K
Hybrid Path
- Vs = $1.2M (30% cost reduction, faster ramp)
- Cf = $600K (reduced environmental benefit, partial solvent infrastructure)
- P(success) = 75% (leverages proven wet anode process)
- EV = (0.75 × $1.2M) – (0.25 × $600K) = $900K – $150K = $750K
EV Winner: Hybrid ($750K vs. -$240K)
C. What Tesla Actually Did
Tesla quietly shifted to hybrid manufacturing in 2023-2024, using wet coating for anodes while continuing dry cathode development. Currently, Tesla’s 4680 batteries only use dry electrode technology for the lower-cost anode, while the more expensive cathode is still sourced from LG Energy Solution using traditional wet technology (Automotive Manufacturing Solutions, 2024).
In May 2024, Musk admitted that pursuing the dry battery electrode process in 4680 cells “was a mistake” for immediate mass production (Autoevolution via Batteries News, 2024).
The Kill Criterion that mattered: Manufacturing yield + Timeline. When your probability of success drops below 50% and your failure cost includes missing a product launch, the math is brutal. A negative EV means every dollar spent makes the problem worse.
Key Insight: This is the “dry electrode moment” every engineering leader faces—when the technically seductive idea becomes a resource trap. Tesla didn’t abandon dry electrodes entirely; they de-risked the path by hybridizing. They’re still pursuing full DBE, but not on the critical path for production.
🔋Pivot Three: Full Structural Pack vs. Modified Structural Pack (2022-2024)
A. The Technical Comparison (Paired Comparison)
Tesla’s structural battery pack promised to make the battery a load-bearing chassis member, eliminating redundant structure.
Criteria
- Weight Savings (vehicle efficiency)
- Serviceability (repair cost, insurance impact)
- Manufacturing Integration (assembly complexity)
How We Score It
Paired Comparison Winner: Modified Structural (3 vs. 3, tie)
This is where Paired Comparison alone fails you. Both options have merit. You need the business filter.
B. The Business Reality (Expected Value)
The Hidden Liability Time Bomb
For many electric vehicles, there is no way to repair or assess even slightly damaged battery packs after accidents, forcing insurance companies to write off cars with few miles—leading to higher premiums (Reuters, March 2023). Tesla’s Texas-built Model Y structural battery pack has been described by experts as having “zero repairability” (Reuters, March 2023).
A $61,000 2022 Model Y Long Range EV was in a front collision and would have cost more than $50,000 to fix, leading the insurer to total the vehicle (Insurance Institute Analysis, 2023). Industry reports indicate that seemingly minor accidents could result in repair bills exceeding £20,000 for the battery pack (UK Insurance Data, 2023).
EV Model Assumptions
- Fleet size: 50,000 vehicles over 3 years
- Insurance classification impact on residual values and total loss frequency
Note: The dollar values below are illustrative calculations based on reported repair costs and insurance industry feedback on structural pack designs. The probability estimates reflect insurance industry concerns about non-serviceable battery architectures.
Full Structural Path
- Vs = $800K (10% weight savings → efficiency gains)
- Cf = $1.2M (insurance reclassification, resale value collapse, warranty exposure from minor accidents)
- P(success) = 60% (technical success, but market rejection risk)
- EV = (0.60 × $800K) – (0.40 × $1.2M) = $480K – $480K = $0
Modified Structural Path
- Vs = $650K (7% weight savings)
- Cf = $300K (slightly more complex assembly)
- P(success) = 85% (proven serviceability maintains resale value)
- EV = (0.85 × $650K) – (0.15 × $300K) = $552K – $45K = $507K
EV Winner: Modified Structural ($507K vs. $0)
C. What Tesla Actually Did
Tesla’s structural battery pack can be removed from the Model Y crossover, contrary to earlier designs (InsideEVs, 2022). Tesla redesigned the structural pack to be serviceable, adding access panels and separation points.
The Kill Criterion that mattered: Operational constraint (serviceability). When your “10% weight savings” technical win creates a market-killing liability that insurance companies won’t underwrite, you’ve optimized the wrong variable.
Key Insight: The full structural pack had a zero EV, meaning it was expected to break even at best. But the downside risk (insurance industry rejection, resale market collapse) was asymmetric. Sometimes the right call is to walk away from a neutral EV when the failure mode is existential.
🤔The Pattern: When to Kill Your Best Ideas
Let’s compare all three pivots side-by-side:
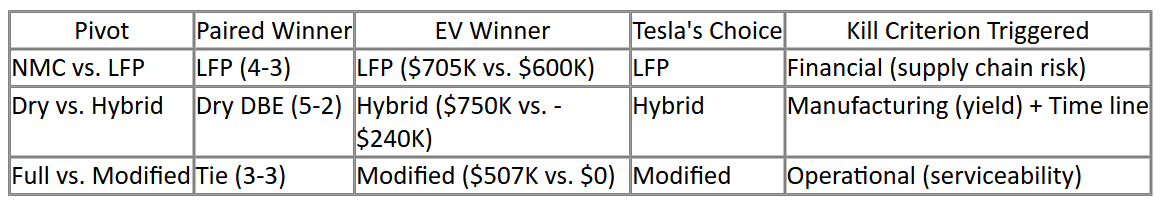
The throughline: In every case, Tesla chose the option with higher probability of success and lower failure cost, even when it meant sacrificing technical performance.
📋👨💼How to Apply This in Your Organization
Start Small (30-Minute Exercise)
- Pick one active project with 2-3 competing design paths
- Run Paired Comparison on technical merit (just like we did with materials in Choose-It)
- Run a simple EV calculation using your project’s actual budget and timeline risk
- Ask: “Does our technical favorite survive the business filter?”
The Two-Filter Decision Process
For any innovation decision with competing paths:
Filter 1: Technical Feasibility (Paired Comparison)
- Define 3-5 criteria that matter for your specific application
- Compare options head-to-head on each criterion
- Identify the technical favorite
Filter 2: Business Viability (Expected Value)
- Estimate value of success (Vs) and cost of failure (Cf)
- Assign probability based on your Phase 2 investigation
- Calculate EV for each path
- Identify the business favorite
Decision Rules:
- If both filters agree → Clear choice
- If they disagree → The business filter wins (unless existential risk)
- If EV is negative → Kill it, regardless of technical merit
- If EV is near zero → Examine failure modes for asymmetric risk
The Red Flag Test
If your Paired Comparison winner has a negative EV, you’ve found a “Tesla Dry Cathode moment”, which is a technically seductive idea that will drain resources. That’s when you need the discipline to walk away.
Document Your Decision Trail
When a systematically made decision doesn’t work out, you have something valuable: a documented trail of what evidence you had, what you expected, and where reality diverged. This turns “failure” into organizational learning.
Create a decision log that captures:
- Your Phase 1 framing (what constraints mattered)
- Your Phase 2 confidence levels (what you knew)
- Your Phase 3 rationale (why you chose this path)
This isn’t CYA documentation! It’s how you build institutional knowledge about what works in your specific context.
The Uncomfortable Truth About Innovation
Tesla’s three pivots teach us this: The gap between “technically impressive” and “business viable” is where most innovations die. Paired Comparison helps you see what engineers love. EV helps you see what businesses need.
Your job as an engineering leader isn’t to pick the coolest technology. It’s to pick the one that survives contact with reality. Things like manufacturing constraints, supply chains, insurance actuaries, and customers who expect their $50K vehicle to be repairable.
Sometimes that means killing your best idea. Not because it’s wrong, but because the timing, risk, or cost makes it the wrong idea right now.
That’s not failure. That’s discipline.
Here’s your homework: Look at your current project portfolio. How many initiatives would survive if you ran them through these two filters today? If the answer makes you uncomfortable, you’ve just identified where to focus your next leadership conversation.
What design decision is keeping you up at night? Hit reply and let me know—your challenges shape my content.
And if you need hands-on help: Book a discovery call.
Sources Cited
“Musk Admits That Pursuing the Dry Battery Electrode Process in 4680 Cells Was a Mistake.” Autoevolution.com via Batteries News, 13 May 2024. https://batteriesnews.com/autoevolution-musk-admits-that-pursuing-the-dry-battery-electrode-process-in-4680-cells-was-a-mistake/
Manthey, Nora. “Tesla Battery Day: Tabless 4680 cell and a $25k car.” Electrive.com, 23 Sept. 2020. https://www.electrive.com/2020/09/23/tesla-battery-day-tabless-4680-cell-and-in-house-production/
“Benefits of LFP Batteries.” Recurrent Auto, 2023. https://www.recurrentauto.com/research/lfp-battery-in-your-next-ev-tesla-and-others-say-yes
“LFP vs. NMC Battery: Switching Standard Range Models.” Eco Lithium Battery, 2021. https://www.ecolithiumbattery.com/lfp-vs-nmc-battery/
“Tesla will change the type of battery cells it uses in all its standard-range cars.” CNBC, 20 Oct. 2021.
Tesla Q4 2021 Earnings Call. Tesla, Inc., 26 Jan. 2022.
“Tesla’s dry-coating process for cathodes and manufacturing challenges.” The Information, 2024.
“Tesla didn’t achieve the goal of reinventing the battery manufacturing process by using dry electrodes.” Automotive Manufacturing Solutions, 2024.
“Tesla’s structural battery pack can be removed from the crossover.” InsideEVs, 2022. https://insideevs.com/news/587147/tesla-structural-battery-pack-removal-replacement/
“For many electric vehicles, there is no way to repair or assess even slightly damaged battery packs after accidents.” Reuters, 20 Mar. 2023.
“Global cobalt consumption increased 20% from 2020 to 2021.” IEA Global Supply Chains of EV Batteries Report, 2022.
“Key battery metals such as cobalt and nickel are already facing supply chain constraints.” IEA, 2022.